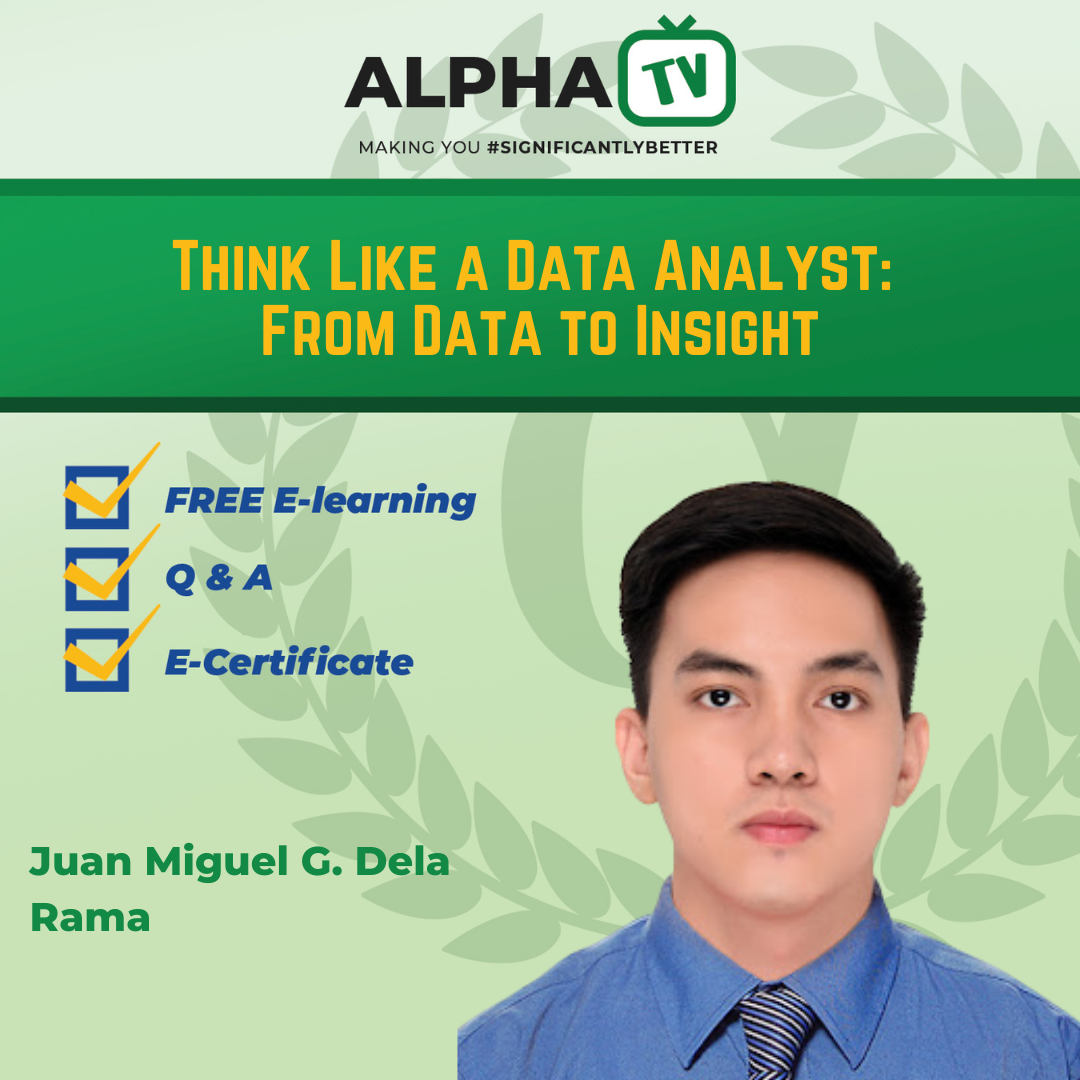
About the Course
Becoming an effective data analyst requires more than just knowing how to run queries or build charts, it demands a structured, end-to-end analytical mindset. Organizations do not just need raw reports, they need reliable data pipelines, intuitive visual dashboards, and strategic business recommendations that turn complex datasets into actionable growth opportunities.
This course guides participants through the full workflow of a professional data analyst. Featuring practical demonstrations using SQL and Tableau, participants will explore how to translate stakeholder requirements, clean messy datasets, perform root-cause analysis, build interactive dual-axis dashboards, and present evidence-based insights that drive executive decision-making.
Course Objective
- To master the end-to-end data analyst workflow: Communicate, Clean, Analyze, Visualize, and Recommend
- To apply domain expertise and core tools (SQL, Excel, Tableau) to build reliable data pipelines and interactive dashboards
- To construct key operational performance indicators (such as Yield, Attainment, and Defect Rates) and translate visual trends into business recommendations
Course Outline
- The Mindset and Role of a Modern Data Analyst- Bridging technical capabilities with domain knowledge (manufacturing, finance, HR, and sales)
- Understanding the core tech stack: Excel, SQL, Python, and Business Intelligence (BI) platforms
- Stakeholder Communication and Problem Framing- Translating raw business requests into structured technical requirements and KPI targets
- Establishing clear project scopes before writing queries or building reports
- Data Preparation and SQL Pipeline Querying- Performing data cleaning, filtering, and aggregation using MySQL (`WHERE`, `DISTINCT`, `BETWEEN`)
- Handling messy text formats, extra spaces, and date formatting directly in database queries
- Data Visualization and Interactive Dashboard Design in Tableau- Building dual-axis charts, stacked bars, line graph targets, and synchronized axes
- Designing donut charts for yield percentages and configuring dynamic KPI displays and filters
- From Dashboard Insights to Business Recommendations- Identifying operational bottlenecks, micro-stoppages, and top defect categories
- Delivering actionable, executive-ready business recommendations that drive measurable impact
Target Participants
This course is designed for:
- Aspiring data analysts, industrial engineers, and business intelligence professionals
- Process leads, operations supervisors, and sales analysts looking to enhance their reporting capabilities
- Professionals seeking practical, real-world skills in SQL data cleaning and Tableau dashboard development
- Team leaders and managers wanting to foster a data-driven culture within their departments
Certificate Requirements
- Completion of recorded webinar + quiz
- Pass the 10-item multiple choice with 80% mark
- Comment your feedback on the main page of the course
What is an LMS?
An LMS (Learning Management System) is a software platform designed to manage, deliver, and track educational content and training programs online.
How does an LMS work?
An LMS provides a centralized platform for creating, delivering, and managing learning materials. It offers features like course creation, assessments, communication tools, and progress tracking.
Who can use the LMS?
Our LMS is designed for a wide range of users, including educators, students, trainers, HR professionals, and corporate users seeking to deliver and manage training and educational content.
How do I access courses on the LMS?
After logging in, you'll see a list of available courses on your dashboard. Click on a course to access its content, including modules, videos, assignments, and quizzes.
Can I take courses on any device?
Yes, our LMS is responsive and works on various devices, including desktops, laptops, tablets, and smartphones.
How do I enroll in a course?
If you're a student, your courses might be assigned by an instructor. If you're a corporate user, courses can be assigned by your administrator. Simply click on the course to enroll.
How are assessments conducted?
Assessments can include quizzes, assignments, and exams. You'll find instructions within each course on how to complete them.
How do I track my progress?
Your progress is automatically tracked as you complete modules, quizzes, and assignments. You can view your progress on your dashboard or course page.
I'm having trouble accessing the platform. What should I do?
If you're experiencing technical difficulties, please reach out to our support team at asklexnow@gmail.com or send a ticket through our support form
What if I forget my password or username?
You can use the "Forgot Password" option on the login page to reset your password. If you've forgotten your username, contact our support team for assistance.
Is my personal information safe on the LMS?
We take your privacy seriously. Your personal information is securely stored and used only for educational and administrative purposes in accordance with our privacy policy.
Are my course progress and grades kept private?
Yes, your course progress and grades are confidential and can only be viewed by you, your instructors, and administrators as needed.
TA

OC
RC